Proven, Proprietary Analytics Predict Stock Movement with Unmatched Precision


Proprietary buy/sell indicators per equity delivering clear entry signals and profit targets
Extensive research has shown that market signals and indicators are too subjective.
In addition, financial and market data volumes are so vast that individuals, and even many models, cannot process and incorporate all of it into a fully-informed trading strategy.
State Modeling uses machine-learning quantitative mathematics to analyze huge data-sets, identify patterns, and correlate them to probable future outcomes, creating data-driven, objective analytics.


In State Modeling, there are 4 bullish states and 4 bearish states. The states are numbered 1-8. Odd numbered states are bullish (green) with State 1 being the most bullish. Even numbered states are bearish (red) with State 8 being the most bearish.
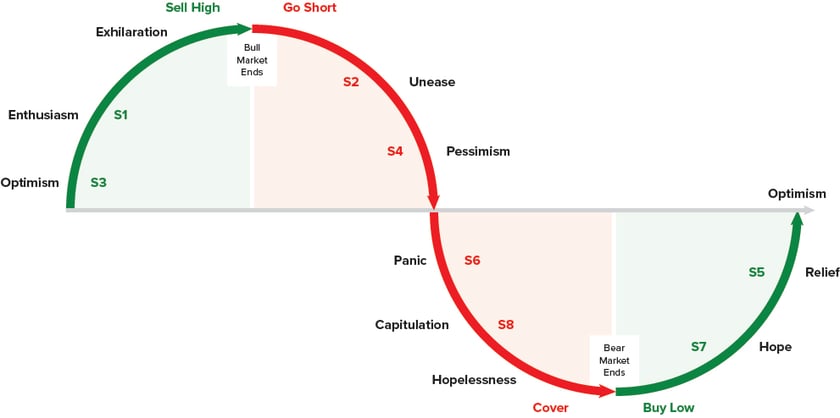
With State Modeling, a stock is either bullish or bearish, with gradations of each. State Modeling also provides clear entry signals with profit targets and stop losses.
 Predicts direction and momentum

ML-driven profit targets and stop loss
 Predicts time to reach target
Every time a stock enters a new state, Delphian provides 3 profit targets (conservative, moderate and aggressive) and 3 stop loss prices for traders to consider.
These targets are displayed on a chart and can be used as support and resistance prices for traders’ strategies.
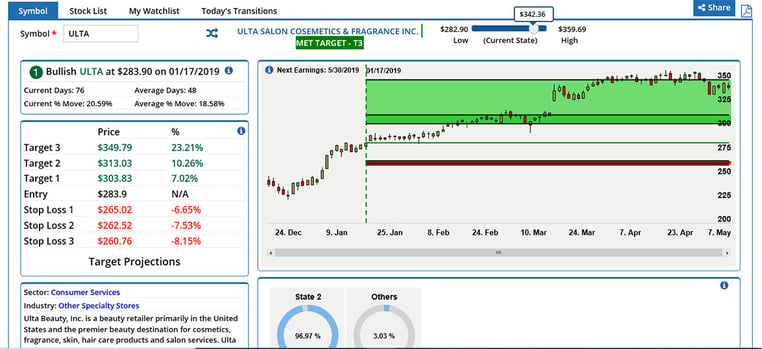
In addition to direction and important price points, Delphian provides the average move within an average timeframe for each stock in each state so you can set your trading expectations.
Lastly, State Modeling provides the probabilities of what state the stock will transition to next so you know the odds of a trend continuing or reversing, based on our proprietary analytics.
There are many different ways to trade, some people are day traders and some are buy and hold.
State Modeling would be classified as a swing trading or position trading system. Generally, our trade analytics cover a holding period of a few weeks to a few months; however, our targets are sometimes met within a few days.
Below is a list of stocks that have recently transitioned into new states (signals) and have met predicted target prices. Click on a stock to highlight it and see the date of the forecast and the different price points (price on signal date, predicted price and current price) plus a graphic of recent pricing history showing price targets.